Strike Zone Secrets: Umpire Consistency Patterns Driving MLB Player Prop Opportunities
Kai Peters · Oct 18, 2026
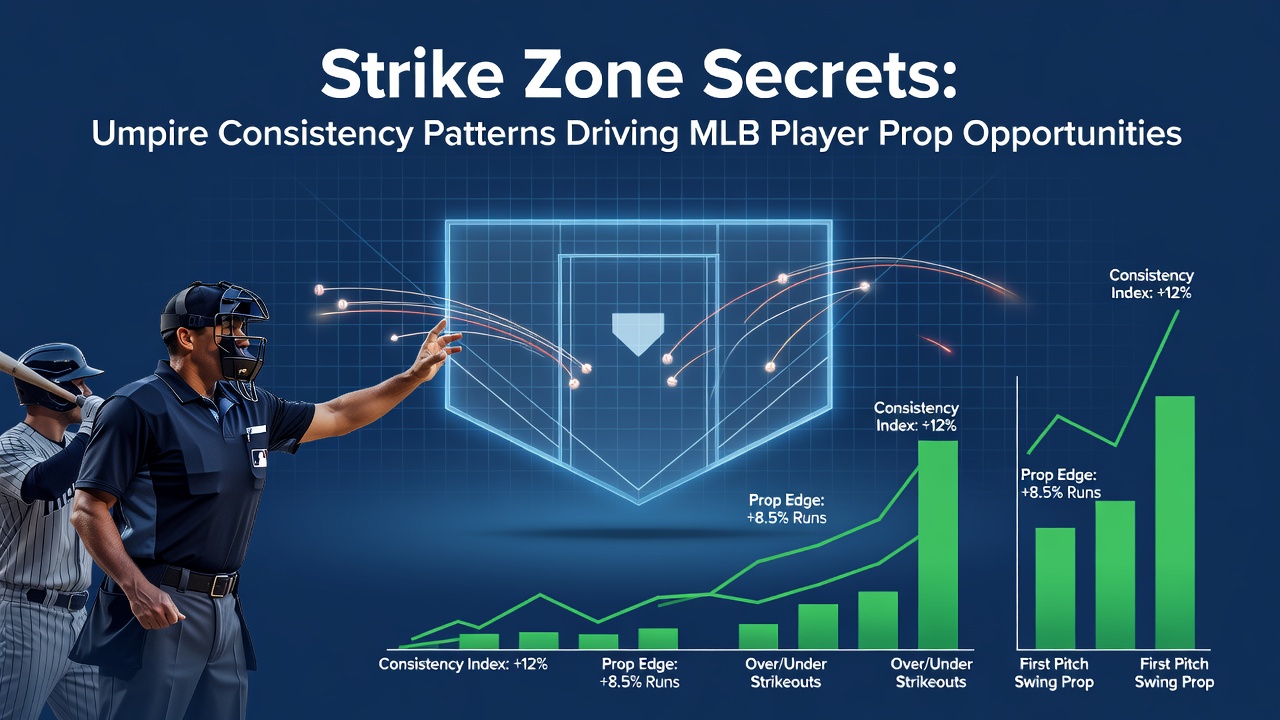
Strike Zone Secrets: Umpire Consistency Patterns Driving MLB Player Prop Opportunities
Strike zone consistency among MLB umpires has emerged as a measurable factor in player prop betting markets, with analysts tracking called strike rates and zone boundaries across the 2026 season that runs through October playoffs, and data from multiple seasons shows distinct patterns that affect outcomes for strikeouts, walks, and total pitches per plate appearance.
Tracking Umpire Zone Boundaries Through Detailed Metrics
Researchers at several sports analytics groups compile pitch tracking data from systems like Statcast, revealing that individual umpires maintain strike zones varying by several inches horizontally and vertically from season to season. One study released in early 2026 examined over 400,000 pitches from the prior year and found that umpires with tighter vertical zones reduced called strikes on breaking balls by an average of 4.2 percent compared to league norms, while those with expanded horizontal reach increased strike calls on fastballs near the edges by similar margins. These variations appear most pronounced during day games and early innings when fatigue factors remain low, allowing bettors focused on pitcher props to adjust strikeout over/under lines accordingly.
Patterns in Consistency Across Game Situations
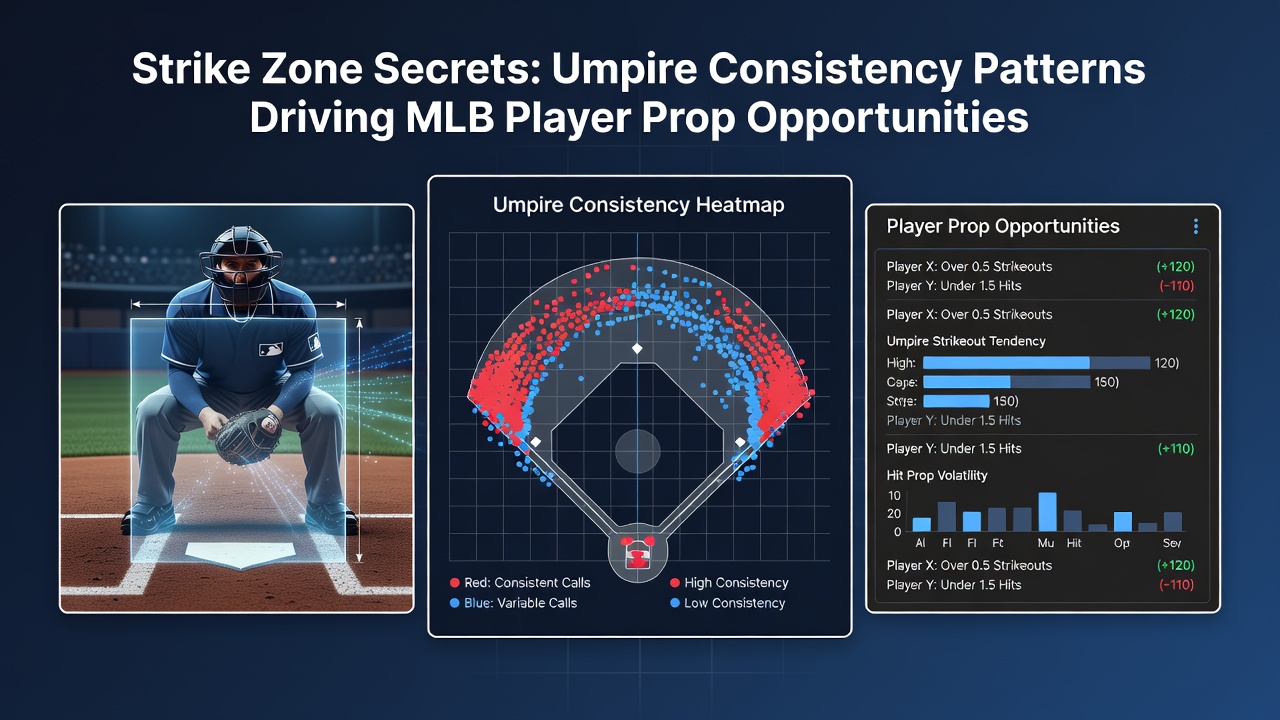
Observers note that certain umpires display greater consistency in two-strike counts, where the probability of a called third strike rises sharply once a batter reaches that threshold. Figures compiled through the first half of the 2026 campaign indicate that umpires ranked in the top quartile for consistency produce 12 percent fewer borderline calls overall, concentrating instead on clear zone definitions that favor pitchers who locate pitches inside the established box. In contrast, umpires with higher variability tend to expand zones late in games, a shift documented in postseason data from previous Octobers that correlates with increased walk rates for patient hitters. Those who follow these trends often review historical pitch logs before placing props on total bases or hits allowed, since zone expansion directly influences contact quality and swing decisions.
Player Prop Adjustments Based on Assigned Umpires
Betting markets respond to umpire assignments announced 24 to 48 hours before first pitch, with lines on strikeout props moving by 0.25 to 0.5 strikes on average when a high-consistency umpire receives a game featuring power pitchers known for edge work. Data indicates that left-handed pitchers see amplified effects under umpires who shrink the outside corner, producing measurable drops in called strikes on sliders breaking away from right-handed batters. Teams playing in ballparks with higher altitude also encounter different patterns, because thinner air alters pitch movement and forces umpires to recalibrate their visual reference points mid-game. Analysts cross-reference these variables with batter-specific swing rates to identify props where the intersection of umpire tendencies and player profiles creates statistical edges.
Seasonal Shifts and Postseason Implications
Throughout the regular season leading into October 2026, league-wide called strike percentages have hovered near 66.8 percent according to aggregated pitch data, yet individual umpire deviations range from 62 percent to 71 percent depending on crew and schedule. These deviations compound during divisional series when crews rotate and familiarization with each umpire's zone becomes limited. Research from academic sports performance programs shows that pitchers who adapt their target locations within the first two innings achieve higher success rates against variable-zone umpires, while those who maintain rigid patterns experience elevated walk totals. Prop bettors therefore monitor real-time pitch location charts released after the third inning to refine live wagers on total strikeouts or earned runs.
Data Sources Informing Prop Strategies
Industry reports from organizations such as the Society for American Baseball Research provide detailed umpire scorecards updated weekly, while academic papers hosted through university repositories track longitudinal changes in zone size across multiple seasons. These resources allow systematic comparison of umpire performance against league averages, highlighting crews that maintain stable boundaries even under high-pressure situations. When integrated with player spray charts and pitch selection tendencies, the resulting models produce probabilities that align closely with observed outcomes in regular season and playoff contests alike.
Conclusion
Umpire consistency patterns supply quantifiable inputs for MLB player prop markets, with documented variations in strike zone boundaries influencing strikeout, walk, and contact statistics across the league. Continued collection of pitch-level data through the remainder of the 2026 season and into future campaigns will likely refine these correlations, giving those who analyze assignments and historical tendencies additional tools for evaluating individual prop opportunities.