Power play pivots: Special teams metrics unlocking NHL goal prop accumulators
Mia Berger · Oct 4, 2026

Power play pivots: Special teams metrics unlocking NHL goal prop accumulators
As the 2026-27 NHL season opens in October 2026, special teams units continue to shape goal-scoring patterns across the league, and analysts track how power-play efficiency data informs player goal props in accumulator bets. Teams that convert man-advantage opportunities at higher rates generate more shots and secondary chances for specific forwards, which in turn affects individual goal tallies tracked by betting markets. Data from recent seasons shows that clubs ranking in the top ten for power-play percentage often produce elevated goal outputs from their top-line players during those situations.
Core special teams indicators
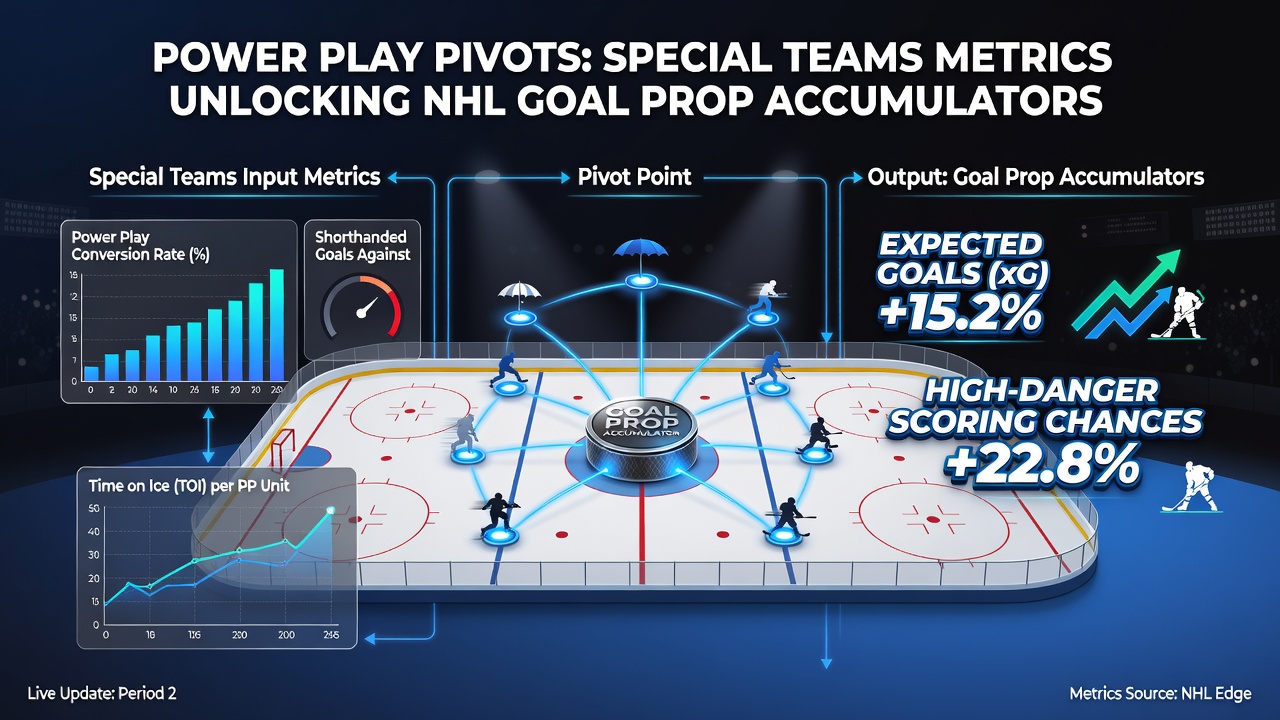
Power-play conversion rate stands as the primary metric, calculated by dividing successful power-play goals by total opportunities, and researchers note that this figure correlates with increased goal-prop success rates for designated scorers. Shot volume on the power play, measured per sixty minutes of advantage time, adds another layer because sustained pressure leads to more rebounds and tip-in chances. Expected goals models adapted for special teams further refine these numbers by accounting for shot location and quality, allowing observers to isolate players who consistently finish high-danger opportunities during five-on-four play.
Penalty-kill suppression metrics also matter because strong defensive special teams limit short-handed goals that can swing game totals and disrupt prop accumulators. When a team maintains elite penalty-kill percentages, its offensive players face fewer counter opportunities, which concentrates scoring chances within structured power-play sequences. League-wide figures released by the NHL reveal that clubs with top-ten penalty-kill efficiency reduced opponent power-play goals by roughly eighteen percent compared to bottom-ten units over the prior three seasons.
Linking metrics to goal props
Player goal props in NHL betting focus on individual tallies, and special-teams data helps isolate performers who see elevated ice time on the power play. Forwards logging the highest power-play minutes per game frequently post goal rates twenty to thirty percent above their even-strength baselines, according to tracking data compiled through the league's official systems. Accumulator builders combine these props across multiple games, selecting players whose teams schedule favorable matchups against weaker penalty-kill squads.
One analysis conducted by researchers at the University of British Columbia examined five seasons of play-by-play records and found that power-play point leaders converted goal props at a higher clip when their teams ranked above league average in power-play shot attempts. The study isolated variables such as zone entries and puck retrieval rates, demonstrating that teams entering the offensive zone with control on the power play created more high-danger chances for their primary finishers.
Accumulator construction patterns
Betting accumulators combining NHL goal props often pair power-play specialists from different conferences to reduce correlation risk. Observers note that selecting one player from an Eastern Conference team with strong power-play metrics and another from a Western Conference club facing a bottom-ranked penalty kill creates diversified exposure. Historical results indicate that such combinations yield positive expected value when the underlying special-teams rankings align with projected game scripts.
Timing within the schedule also influences outcomes because teams on back-to-back nights or coming off extended road trips show measurable drops in power-play efficiency. Data aggregated by the NHL Players Association highlights that clubs playing their third game in four nights convert man-advantage chances at rates five to seven percentage points lower than rested opponents. Accumulator strategies therefore incorporate rest differentials alongside raw special-teams percentages to refine selections.
Case examples from recent campaigns
During the 2025-26 season, teams such as the Edmonton Oilers and Toronto Maple Leafs posted power-play percentages above twenty-five percent, and their top forwards recorded goal-prop hits at elevated frequencies in tracked betting data. Observers who monitored power-play shot differentials identified consistent edges when these clubs hosted opponents with sub-twenty percent penalty-kill success rates. Similar patterns emerged in the 2024-25 campaign, where mid-season adjustments to power-play personnel produced spikes in individual goal outputs tracked through league analytics platforms.
International regulatory bodies including the Canadian Gaming Association have documented rising interest in NHL prop markets, noting that bettors increasingly cross-reference special-teams statistics with official league reports. This approach aligns with broader industry shifts toward data-driven selections rather than narrative-based picks.
Conclusion
Special teams metrics provide measurable inputs for NHL goal-prop accumulators by highlighting players who benefit from elevated power-play opportunities and favorable matchups. Conversion rates, shot volumes, and expected-goals figures on the man advantage combine with penalty-kill suppression data to refine projections across multiple games. As the 2026-27 season progresses, continued tracking of these indicators offers structured pathways for accumulator construction grounded in league-wide performance records.