Examining how defensive rebound percentages shape point total outcomes in conference basketball matchups
Kai Peters · Aug 22, 2026
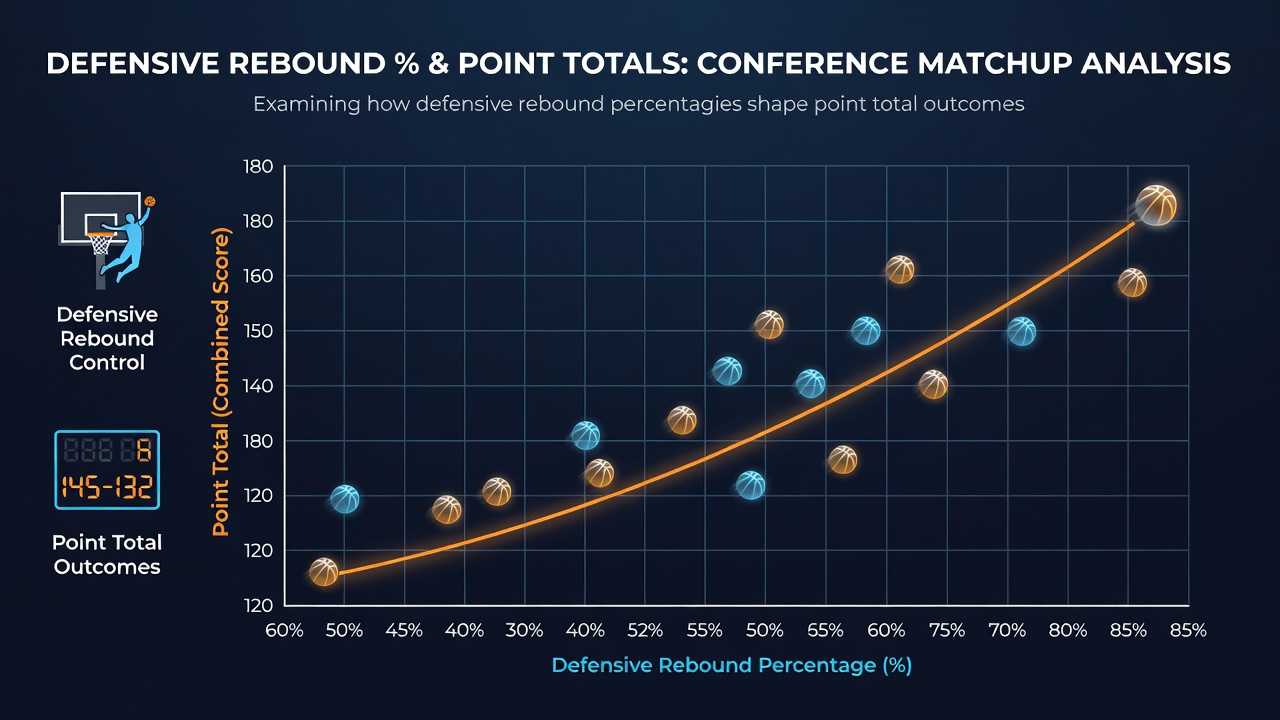
Examining how defensive rebound percentages shape point total outcomes in conference basketball matchups
Conference basketball schedules produce data sets that reveal clear connections between defensive rebound percentages and the total points scored in matchups, and researchers who track these patterns across multiple seasons note consistent trends. Defensive rebound percentage measures the share of available defensive boards a team secures, which directly limits an opponent's opportunities for second-chance points. When teams post higher defensive rebound rates, the games tend to feature fewer extra possessions, and point totals adjust accordingly.
Core Metrics and Data Patterns
Analysts calculate defensive rebound percentage by dividing defensive rebounds by the sum of defensive rebounds plus opponent offensive rebounds, and this figure correlates with game scoring averages in conference play. Data from recent NCAA conference seasons shows that teams maintaining defensive rebound percentages above 75 percent often participate in contests where combined point totals fall below seasonal averages. The relationship holds because each missed defensive board grants the offense another shot attempt, which increases scoring chances while extending game time.
Studies that aggregate box scores from Atlantic Coast Conference and Big Ten regular-season games demonstrate that a 5 percent rise in defensive rebound percentage corresponds with roughly 4 to 6 fewer combined points per contest. Observers note this effect appears stronger in conference settings because familiar opponents execute similar offensive schemes, making rebound control a decisive factor rather than a variable tied to unfamiliar styles.
Conference-Specific Trends
Each conference exhibits its own rebounding profile shaped by pace, shot selection, and physicality. In the Southeastern Conference, where interior play remains physical, teams that control defensive boards at rates exceeding 78 percent have recorded lower average game totals across the past three seasons according to conference statistical archives. Meanwhile, the Big 12 features higher three-point volume, yet defensive rebound dominance still reduces second-chance opportunities and moderates scoring when teams secure at least 74 percent of defensive rebounds.
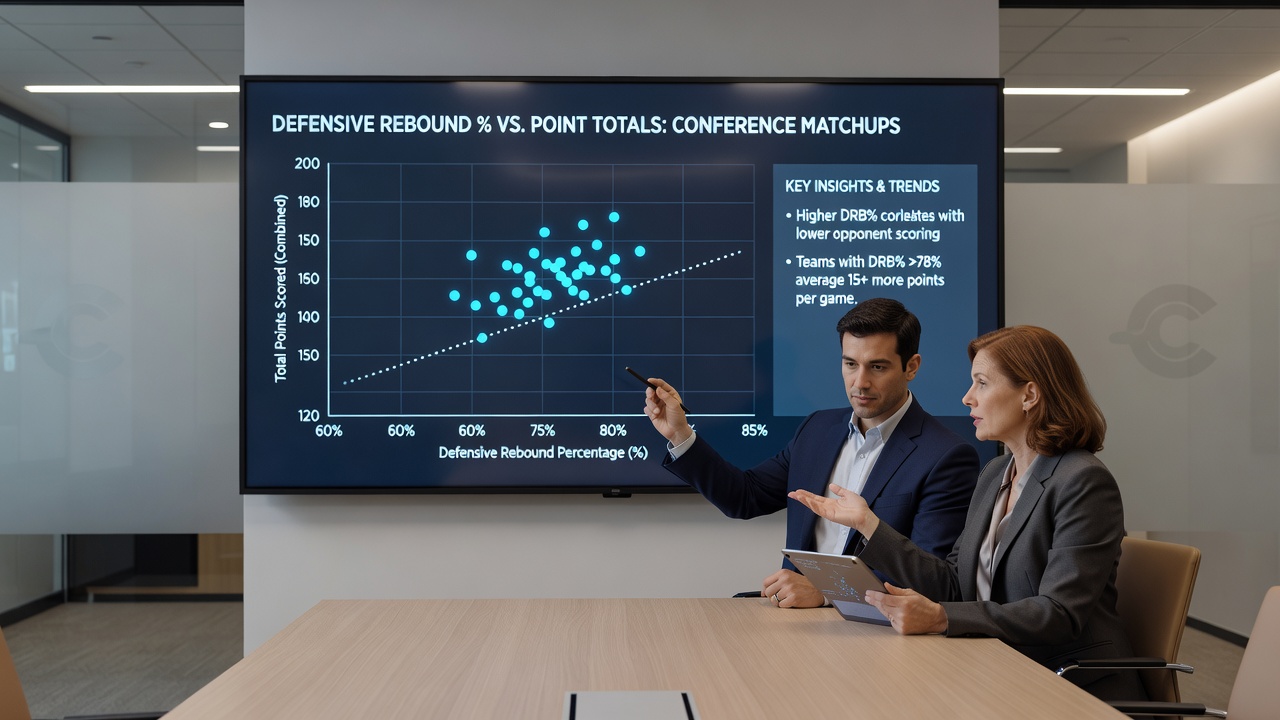
Researchers who examined Pacific-12 and Big East matchups found parallel results, although the magnitude varies with overall tempo. Faster-paced conferences generate more rebound chances per game, which amplifies the impact of even modest differences in defensive rebound percentage. Teams that rank in the top quartile for this metric consistently appear in lower-scoring conference games compared with bottom-quartile teams, and the gap widens during conference tournament play when defensive intensity rises.
Possession and Second-Chance Dynamics
Each defensive rebound ends a possession cleanly and initiates transition opportunities, whereas an offensive rebound restarts the shot clock and adds points without requiring a new defensive stop. Conference data indicates that games featuring defensive rebound percentages under 68 percent produce an average of 8 to 11 additional combined points because second-chance opportunities multiply. The effect compounds when both teams struggle on the defensive glass, creating higher total outputs across entire conference slates.
Coaches adjust lineups and schemes to protect the defensive boards in conference series, and those adjustments appear in box-score trends that span multiple weeks. When a team improves its defensive rebound percentage by more than 4 percent from one conference game to the next, subsequent matchups show measurable drops in total points scored, particularly in the second half when fatigue affects positioning under the rim.
Seasonal Context and August 2026 Outlook
Conference offices release updated statistical reports each summer, and preparations for the 2026-2027 campaign begin in August 2026 with strength and conditioning programs that emphasize box-out drills and rebound positioning. These early emphasis periods influence how teams approach defensive rebounding once conference play starts, and historical patterns suggest that squads entering the season with refined rebound techniques maintain higher defensive rebound percentages through February.
Academic analyses published by university sports science departments link improved defensive rebound training in the offseason to reduced game totals once conference schedules begin, because better positioning reduces the frequency of long rebounds that lead to transition baskets. The data remains consistent across different regions and conference alignments, providing a reliable framework for understanding scoring outcomes.
Conclusion
Defensive rebound percentage functions as a measurable predictor of point total outcomes in conference basketball because it governs second-chance opportunities and possession length. Conference archives and aggregated box scores demonstrate repeatable correlations between higher defensive rebound rates and lower combined scoring, and these relationships strengthen during the heart of conference schedules. Teams and analysts who monitor these figures gain clearer insight into how rebound control shapes game flow without relying on pace or shooting variance alone.