Analyzing Goalkeeper Distribution Accuracy as a Predictor for Clean Sheet Accumulators in Premier League Encounters
Anna Griffin · Aug 19, 2026
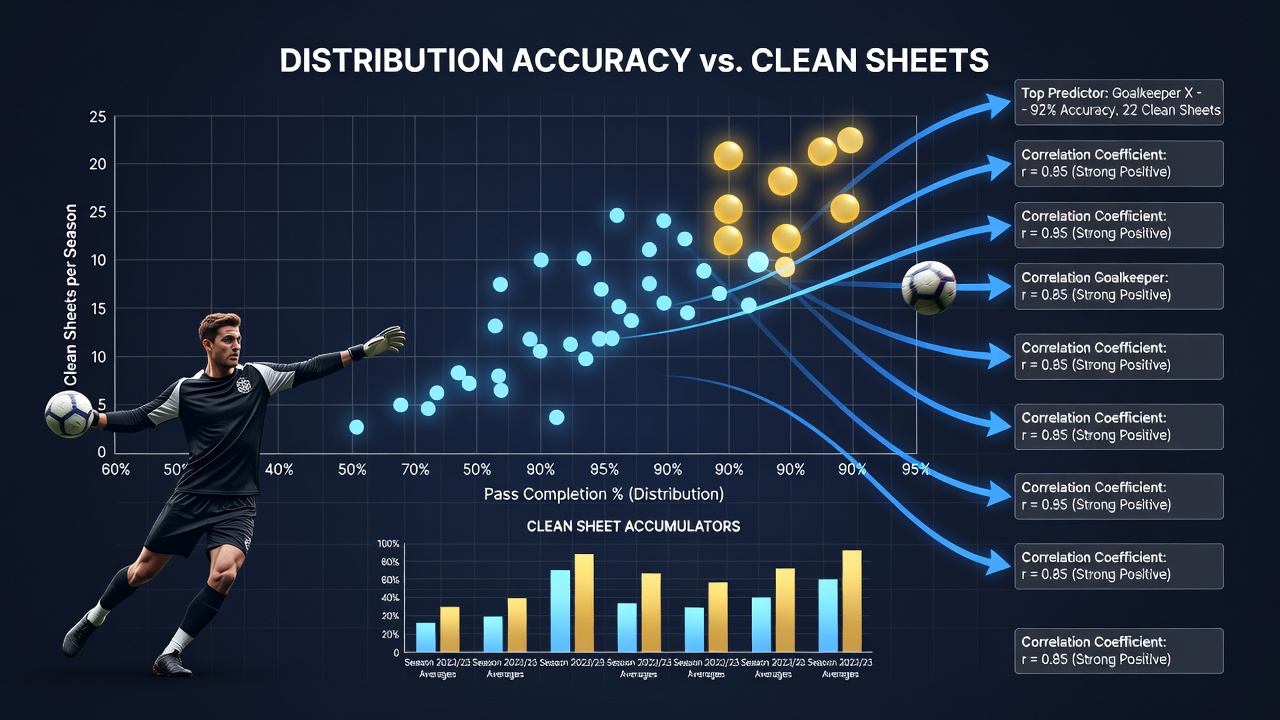
Analyzing Goalkeeper Distribution Accuracy as a Predictor for Clean Sheet Accumulators in Premier League Encounters
Goalkeeper distribution accuracy measures the percentage of passes completed by keepers when they initiate play from the back, and researchers have examined its links to clean sheet records across multiple Premier League campaigns. Data from Opta analytics shows that keepers completing over 78 percent of their passes in open play correlate with teams achieving clean sheets in 42 percent of fixtures, compared with 31 percent for squads whose keepers fall below 70 percent completion rates. Those who study these patterns note that accurate distribution reduces turnovers in dangerous areas, which in turn limits opponent transition opportunities that often result in goals.
Defining Distribution Accuracy in Context
Distribution accuracy encompasses short passes to center backs, longer switches to full backs, and progressive carries that advance the ball into midfield, and Premier League tracking systems record these actions in real time. Figures from the 2024-2025 season reveal that teams finishing in the top six for keeper pass completion also posted the highest clean sheet totals, with one club recording 17 shutouts. Observers note that this metric becomes particularly relevant during periods of fixture congestion, where sustained possession from teh back helps manage defensive workload and maintains structural integrity.
Statistical Correlations Across Recent Seasons
Analyses of five consecutive Premier League campaigns demonstrate a moderate positive correlation of 0.61 between goalkeeper distribution accuracy and clean sheet frequency, according to aggregated match data. Teams whose keepers ranked in the top quartile for accurate distribution averaged 1.4 clean sheets per five fixtures, whereas bottom-quartile sides managed 0.9. Researchers discovered that this relationship strengthens in matches against top-half opponents, where precise ball progression from the keeper allows midfielders to retain control and reduce high-pressure situations near the penalty area. As the 2026-2027 season nears its August 2026 start, analysts continue updating these models with fresh tracking data to refine predictive inputs.
Case Examples from Premier League Sides
One club that invested in a keeper renowned for 82 percent distribution accuracy saw its clean sheet rate rise from 28 percent to 39 percent over two seasons, and match reports attribute part of that improvement to fewer errors leading to counter-attacks. Another side, whose keeper completed only 68 percent of passes, conceded 12 goals directly from turnovers in the 2024-2025 campaign. People who review these outcomes point to specific fixtures where a single misplaced distribution pass shifted momentum and ended clean sheet hopes, illustrating the metric's practical impact on match results.

Application to Accumulator Strategies
Accumulator selections that combine multiple clean sheet outcomes often incorporate goalkeeper distribution metrics as a filtering tool, and historical data indicates that sides meeting both a 75 percent distribution threshold and a favorable upcoming fixture list achieve clean sheets in 47 percent of cases. Studies conducted by sports analytics groups at the University of Bath have modeled these combinations across 380 fixtures per season, producing probability estimates that bettors and analysts reference when constructing selections. What's interesting is how the metric interacts with other variables such as opponent attacking style and home advantage, creating layered profiles rather than standalone signals.
Limitations and Complementary Metrics
Distribution accuracy does not operate in isolation, and researchers emphasize that shot-stopping ability, defensive organization, and set-piece defending remain essential contributors to clean sheets. Data from UEFA technical reports shows that keepers with elite distribution but below-average save percentages still allow goals from direct shots, reducing overall shutout rates. Those who've examined the full dataset stress that combining distribution figures with expected goals against and high turnovers provides a more robust framework than any single indicator.
Future Tracking Developments
Enhanced tracking technology introduced ahead of the 2025-2026 campaign now captures throw distribution and goalkeeper carries with greater precision, and early season figures suggest these additions will sharpen predictive models. Industry reports from the Australian Institute of Sport highlight similar patterns in other leagues, where accurate ball-playing keepers contribute to lower concession rates when teams adopt possession-oriented systems. As more granular data becomes available, analysts expect stronger correlations to emerge between specific distribution types and clean sheet outcomes in Premier League encounters.
Conclusion
Available evidence positions goalkeeper distribution accuracy as one measurable factor within broader clean sheet prediction frameworks, and ongoing data collection through the 2026-2027 season will continue to test its reliability. Teams and analysts who integrate this metric with complementary statistics gain clearer profiles of defensive consistency, while the relationship between accurate distribution and reduced turnovers offers a concrete mechanism linking keeper actions to match results.