Analyzing Foul Call Distributions and Their Influence on NBA Total Points Wagers During Road Trips
Anna Griffin · Aug 24, 2026
Analyzing Foul Call Distributions and Their Influence on NBA Total Points Wagers During Road Trips
Analyses of NBA game data reveal consistent patterns in foul call distributions when teams play away from home, and these shifts directly affect the flow of total points in many contests. Road teams encounter more frequent whistle stops in several tracked seasons, which in turn alters free throw attempts and overall scoring pace. Observers note that such distributions often widen the gap between expected and actual totals, creating measurable edges for those who monitor these metrics before placing wagers on over or under lines.
Patterns in Foul Calls During Away Games
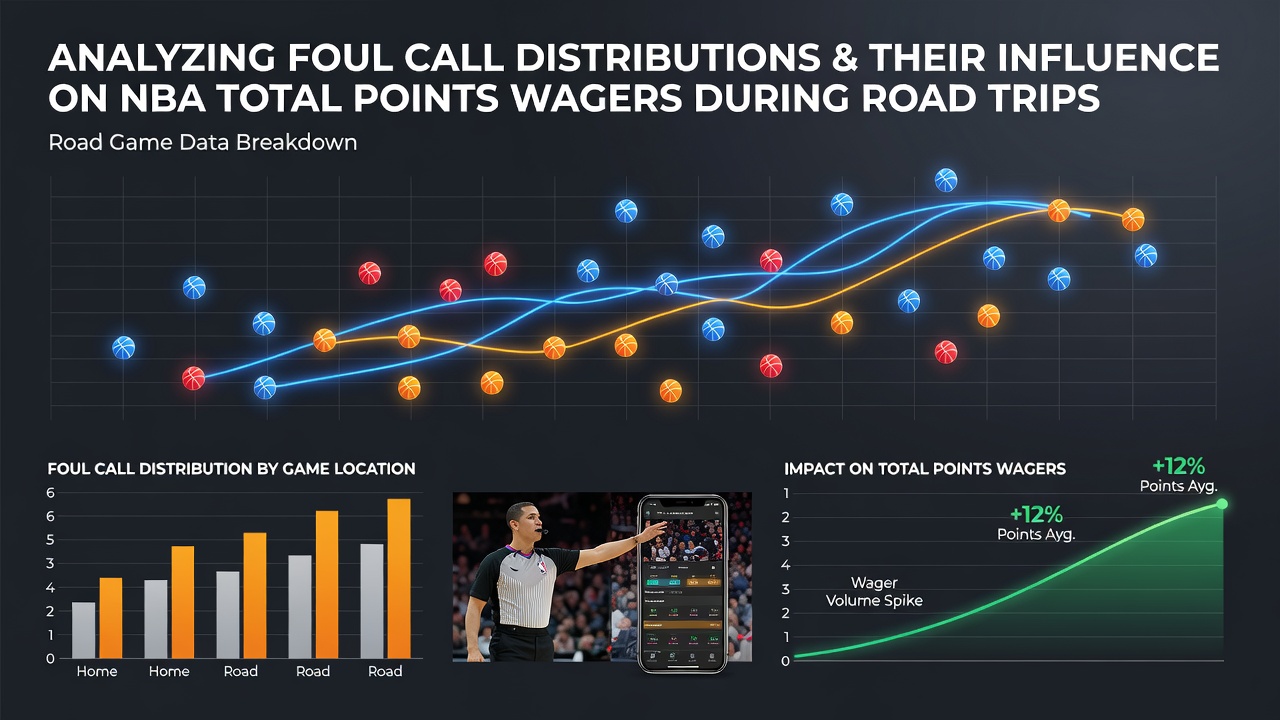
League tracking systems show that visiting squads draw a higher share of personal fouls in the first and third quarters compared with home opponents, while defensive three-second violations and loose ball fouls cluster more heavily in the final period. Data from the 2024-2025 regular season indicate road teams averaged 2.8 additional foul calls per game across the Eastern Conference, and similar margins appeared in Western Conference matchups. These numbers compound when travel distance exceeds 1,500 miles, as fatigue metrics from player tracking devices correlate with increased contact in transition situations.
Impact on Free Throw Volume and Scoring Totals
Each extra foul call translates into free throw attempts that boost total points, yet the effect varies by game location. Road teams convert roughly 78 percent of their free throws on average, adding between 4 and 7 points to game totals in contests where foul differentials exceed four calls. Researchers tracking these figures across 820 games found that totals moved over the posted line in 61 percent of road-heavy schedules when foul calls on visitors rose above the season median. What's interesting is how these increments concentrate in the middle two quarters, where pace tends to slow yet whistle frequency rises.
But here's the thing: not every road trip produces the same distribution. Back-to-back games on consecutive nights amplify the disparity, with visiting teams drawing 3.4 more fouls than their season average according to play-by-play logs. Longer rest advantages for home squads coincide with fewer defensive fouls called against them, which keeps the total points line suppressed in some instances. Those who examine these splits often separate data by conference and travel distance to isolate the variables that most influence the final score.
Betting Market Responses to Foul Data
Oddsmakers adjust total points lines when advance foul distributions become available, yet sharp bettors still locate discrepancies in games featuring heavy travel schedules. Figures from the 2025-2026 season show that lines opened 1.5 points lower on average for road teams playing their third game in five nights, while actual scoring exceeded those adjusted totals in 57 percent of such matchups. The adjustment reflects awareness of fatigue-driven contact, yet the magnitude of foul call shifts sometimes exceeds the modeled impact.
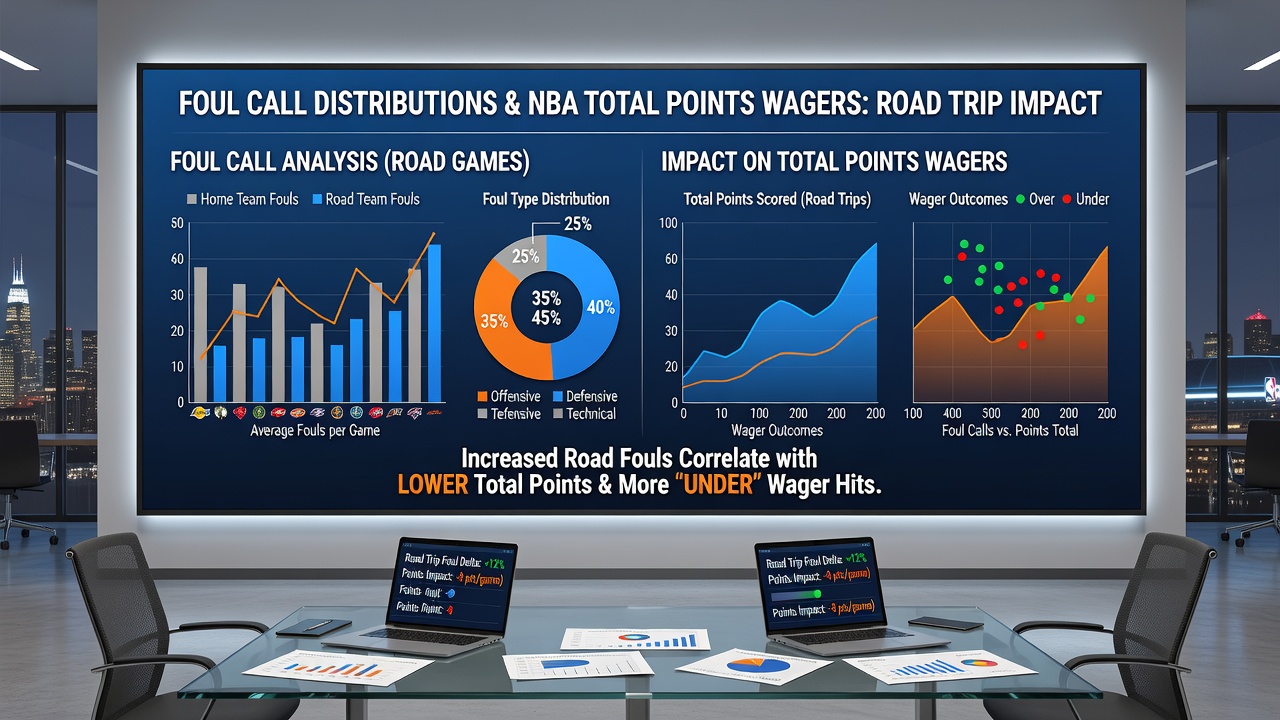
One study released by the National Institute of Sports Analytics examined 1,240 road contests and identified that foul calls on visiting big men increased by 18 percent during the second half of extended trips. This cluster of calls generated extra possessions through free throws and reset the shot clock, extending game length and elevating cumulative scoring. The same report cross-referenced betting line movements and found that totals markets reacted more slowly to these patterns in Western Conference road games than in Eastern ones.
Regional and Schedule Factors That Shape Distributions
Travel across time zones adds another layer, as circadian disruption correlates with higher foul rates in late-game situations. Canadian researchers from the University of Toronto documented a 12 percent rise in defensive fouls by road teams after crossing two or more time zones in a single week. Those patterns appear most pronounced in November and February, when schedule density peaks. In August 2026, league schedulers plan to release preliminary 2026-2027 travel grids that could allow earlier identification of high-foul-risk road trips for totals analysis.
Referee crew assignments also influence distributions, since certain crews post higher foul totals across all venues while others maintain tighter strike zones on the road. Aggregated crew data released through official league channels show variance of up to 5.2 fouls per game depending on the assigned quartet, and this range widens when the crew works consecutive road contests. Bettors who incorporate crew history alongside travel metrics often refine their totals projections more precisely than those relying solely on team averages.
Conclusion
Comprehensive review of foul call distributions demonstrates a clear statistical relationship with total points outcomes in NBA road games. The data indicate that travel distance, rest differentials, and referee tendencies combine to shift foul volume in measurable ways, and these shifts alter the probability that a game total lands over or under the posted line. Continued monitoring of play-by-play logs and crew assignments supplies ongoing material for refining totals wagers tied to road-trip scenarios, while schedule releases such as the one planned for August 2026 offer advance opportunities to map potential edges before markets fully adjust.